")
")
DATA in 6 SIGMA method implementation
The Six Sigma methodology offers a variety of tools and techniques for analysing processes, identifying problems and implementing significant improvements.
Here is a list of the most commonly used tools in the Six Sigma methodology:

Voice of Customer: This is the collection and analysis of customer opinions, preferences and comments in order to understand and improve the user experience. This involves actively listening to customer feedback to guide business decisions and improvement efforts.

Value Stream Mapping: This provides a detailed representation of the key stages in a process, from start to finish, highlighting value-added activities, waiting times, stocks, information flows and other elements.
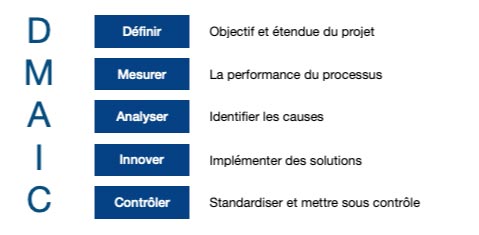
DMAIC: This is an acronym for Define, Measure, Analyze, Improve and Control. It is the basic framework used in the Six Sigma methodology to manage improvement projects.

SIPOC: It stands for Supplier, Input, Process, Output and Customer. It is a tool that maps the process from the point of view of these five elements to better understand the context and stakeholders.

Process Map: A graphical representation of the process showing the stages, inputs, outputs and key activities.
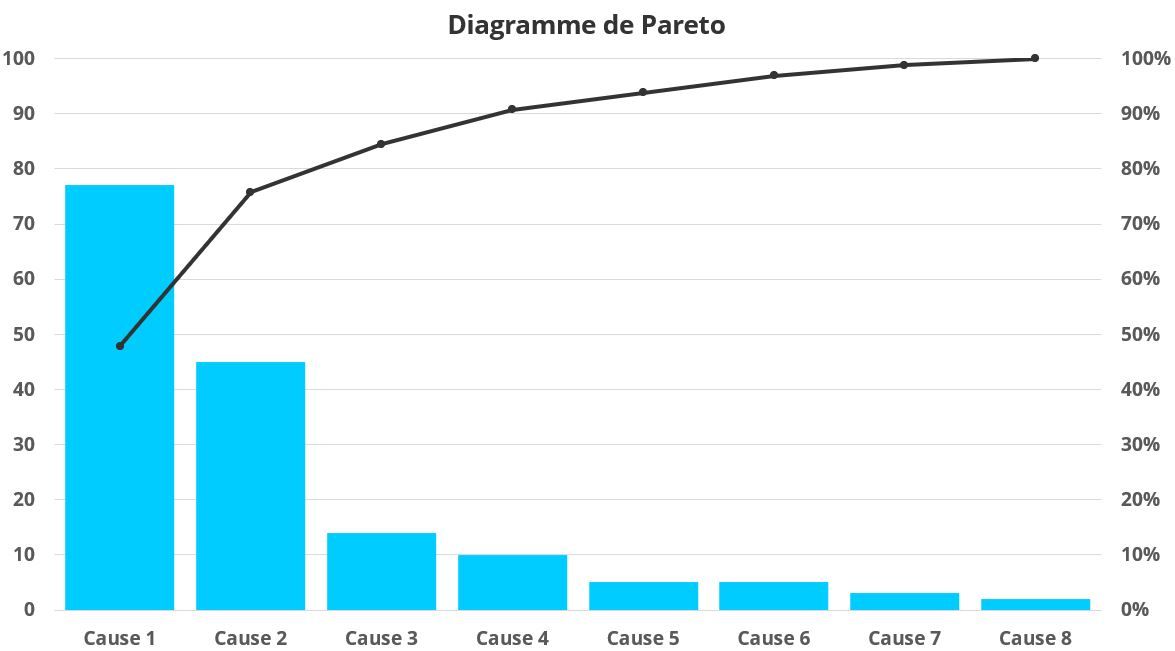
Pareto Chart: A column chart that ranks the causes of problems from most to least frequent, highlighting the main areas requiring attention.

Dispersion Chart: Shows the relationship between two variables, which can help identify correlations and trends.
Regression Analysis: This is used to understand the relationship between a dependent variable and one or more independent variables.

Analysis of Variance (ANOVA): A statistical tool used to analyse the differences between the means of three or more groups.
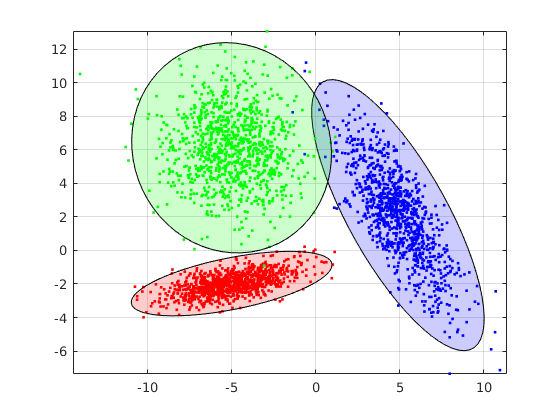
Principal Components Analysis (PCA): A statistical method for simplifying complex data by identifying patterns in the relationships between variables.
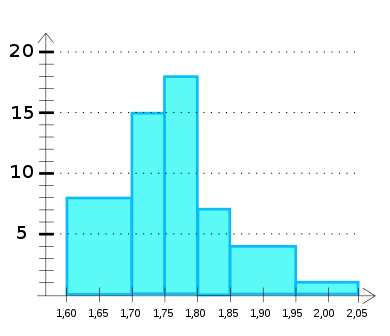
Histogram: A visual graph showing the distribution of data, useful for understanding process variability.
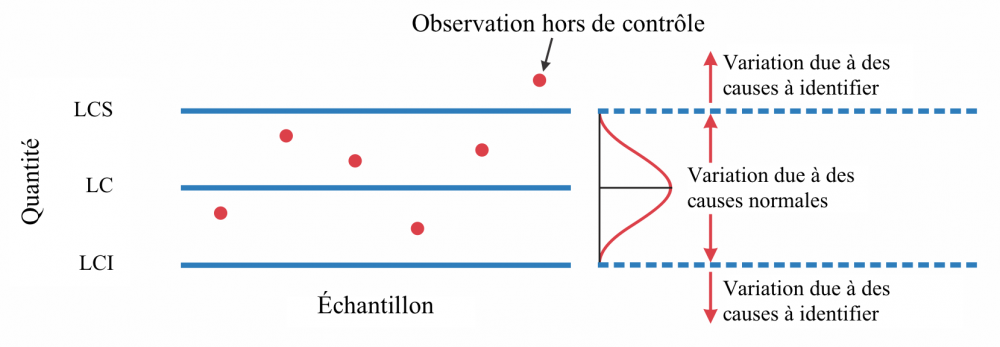
Control Chart: Used to monitor the performance of a process over time by displaying data sequentially.

Ishikawa Diagram (Fishbone diagram): A tool for identifying and ranking the potential causes of a problem, often used in brainstorming teams.
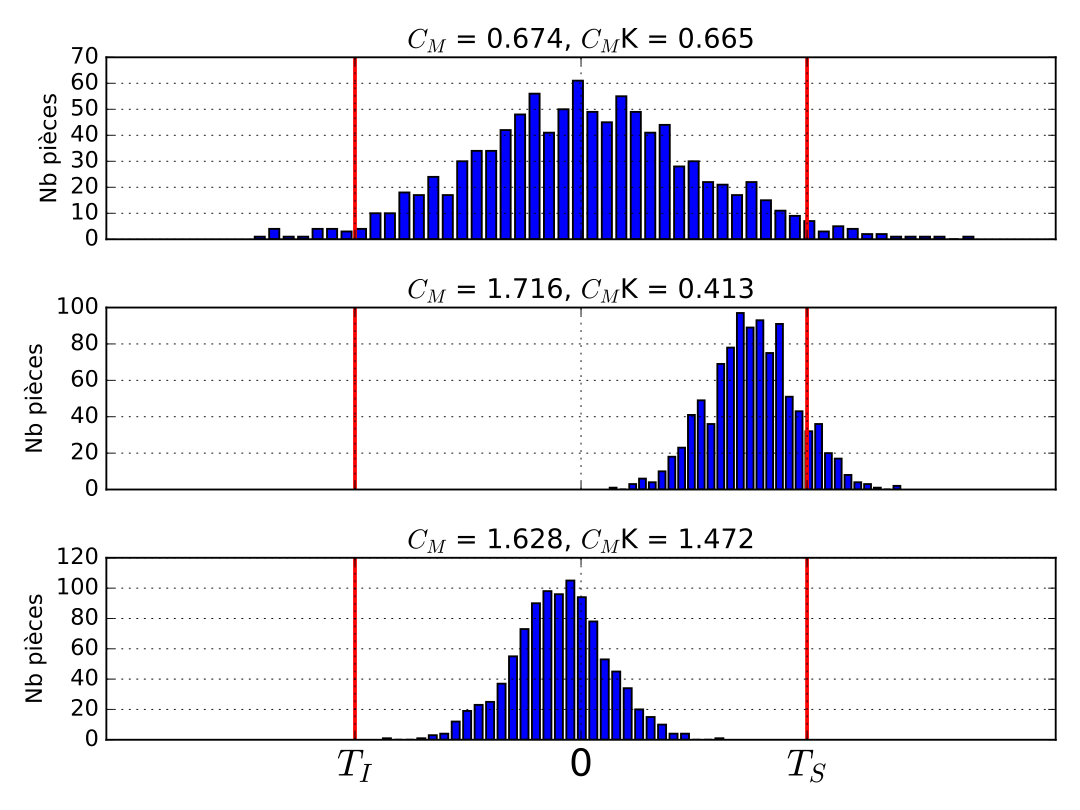
Capability Analysis: This assesses the ability of a process to produce results in line with specifications.
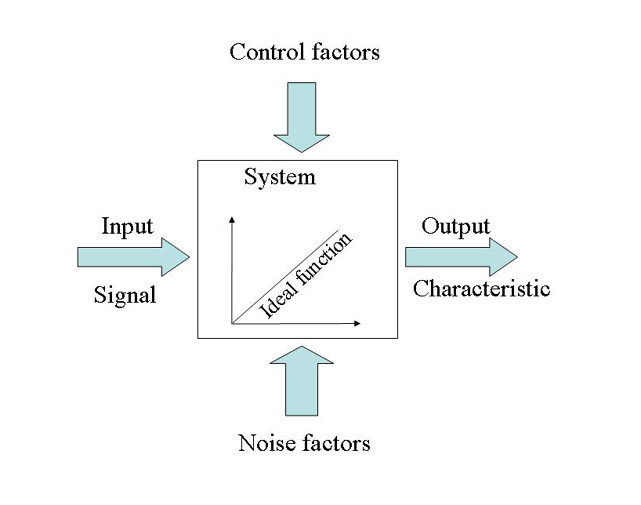
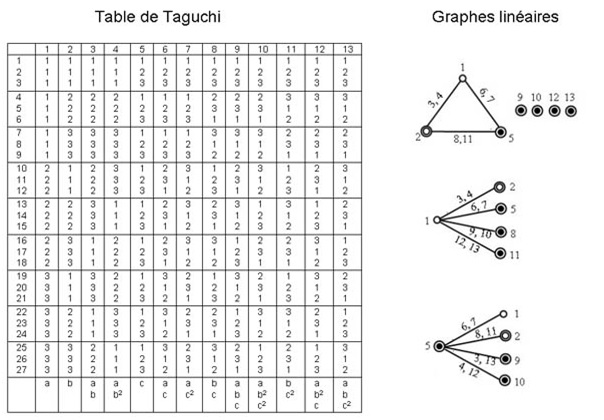
Taguchi Method: A process optimisation technique that identifies the design and manufacturing parameters that have the greatest influence on product variability.
Design of Experiments (DOE): Used to determine the impact of input variables on the outcome of the process and to optimise performance.
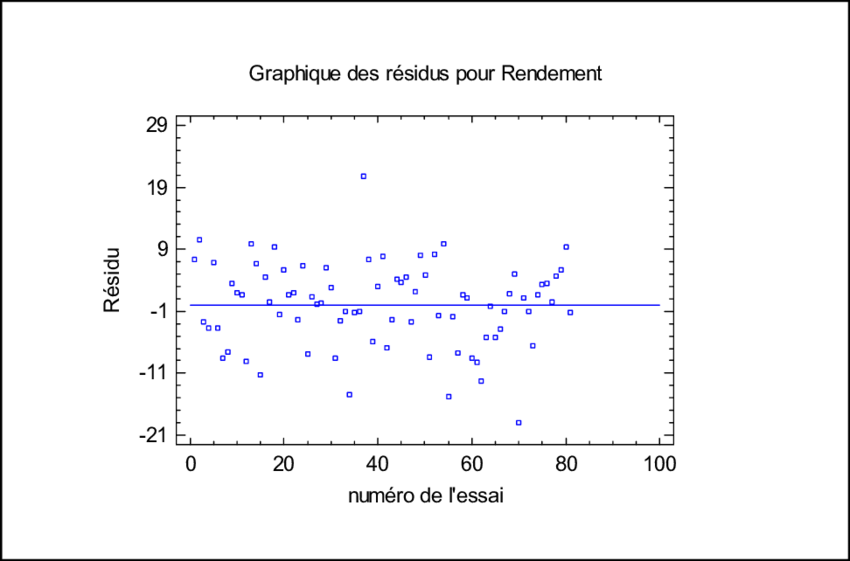
Residual Analysis: Used to check whether data follows a normal distribution, which is essential for many statistical analyses.

Hypothesis Testing: Various statistical tests are used to assess whether observed differences in data are significant or due to chance.
These tools are used flexibly according to the specific needs of the Six Sigma project to help teams understand, measure, analyse, improve and control processes, leading to continuous and sustainable improvements.
Optimising Your Business through Data analysis and Six Sigma
In today's dynamic business landscape, it's imperative to leverage data to ensure your business grows and remains competitive. A proven method of achieving this goal is the integration of Data Valuation with Six Sigma methodology. This systematic approach can significantly improve operational efficiency and enhance the quality of your products or services.
Example 1: Increase Your Margins by Reducing Production Cycle Times
Imagine the positive impact on your profitability of reducing production cycle times. By carefully analysing data at every stage of the process, you can identify inefficiencies and bottlenecks. By applying Six Sigma principles, you can target these problems and make precise changes, resulting in faster processes and higher margins.
Example 2: Build customer loyalty by improving the customer experience
Customer satisfaction is essential to customer loyalty. By analysing customer data - their preferences, comments and complaints - you can discover the stages of the customer experience where improvements are needed. The Six Sigma approach allows you to prioritise these issues and resolve them systematically, improving the customer experience and strengthening their loyalty to your business.
Example 3: Reduce Costs, Increase Profitability
Reducing operational costs is a constant objective. By using data to identify waste and errors, and then applying Six Sigma methods, you can optimise your processes, reducing costs and increasing profitability. This means more profit for your business and greater competitiveness in the marketplace.
Conclusion: Your business, optimised and competitive
By combining in-depth data analysis with Six Sigma methodology, your business can achieve unprecedented levels of performance. This means more efficient operations, increased customer satisfaction and reduced costs. By investing in optimising your processes through data mining and Six Sigma, you create a business that is agile, resilient and ready to meet the challenges of today's marketplace.